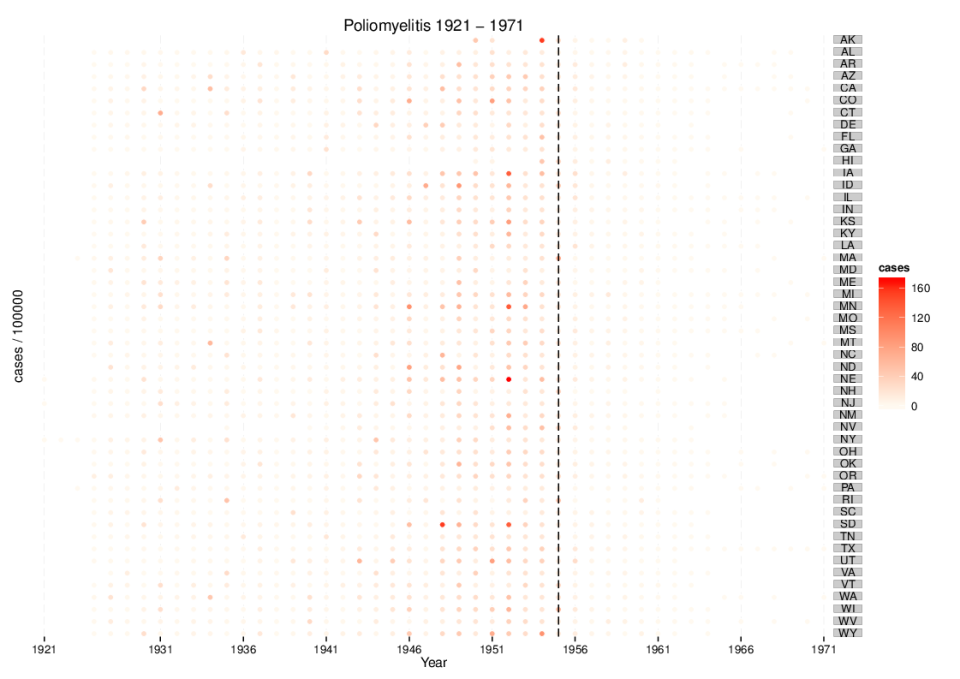
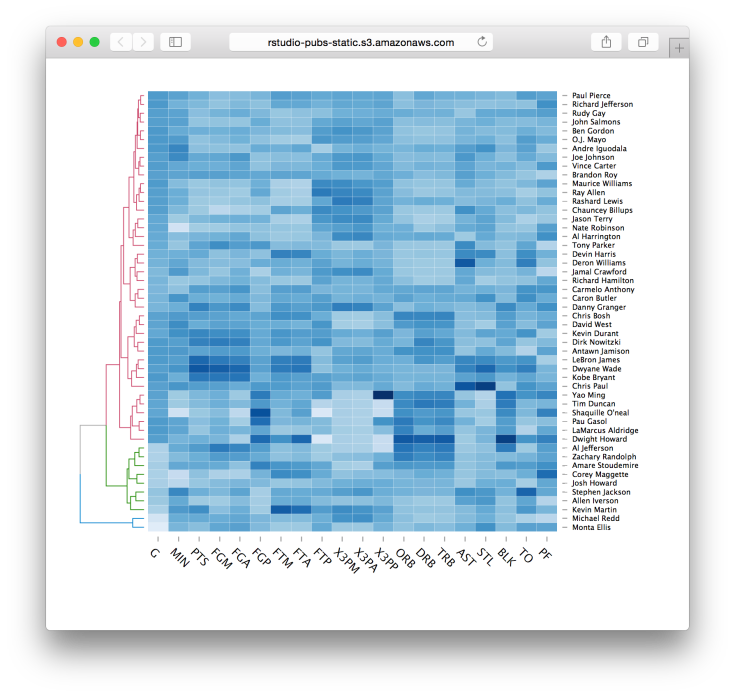
Previously I shared the data visualization approach for descriptive analysis of progress of cohorts with the “layer-cake” chart (part I and part II). In this post, I want to share another interesting visualization that not only can be used for descriptive analysis as well but would be more helpful for analyzing a large number of cohorts. For instance, if you need to form and analyze weekly cohorts, you would have 52 cohorts within a year.
Let’s assume we form weekly cohorts and have 100 ones as of the reporting date. We’ve tracked the number of customers who made a purchase and the total gross margin per weekly cohort per time lapse (a week in our case). We can easily calculate two extra values based on these data:
In addition, I’ve simulated some purchase patterns that can be plausible, specifically:
Furthermore, charts can be represented based on calendar dates and the serial number of the week of the lifetime (e.g. 1st week, 2nd week, etc. from the first purchase date) as well. Therefore, we can see the influence of seasonality or other occurrences on all existing cohorts as of calendar date and the progress of each cohort comparing to the others based on the serial number of the week of the lifetime.
We have placed dates (calendar or week of lifetime) on the x-axis and cohorts on the y-axis. The color of the heatmap represents the value (number of customers, gross margin, per customer gross margin and CLV to date).
Based on this type of visualization we can easily identify general purchasing behaviors, for instance:
#loading libraries
library(dplyr)
library(ggplot2)
library(reshape2)

#simulating dataset
cohorts <- data.frame()
set.seed(10)
for (i in c(1:100)) {
 coh <- data.frame(cohort=i,
 date=c(i:100),
 week.lt=c(1:(100-i+1)),
 num=replicate(1, sample(c(1:40), 100-i+1, rep=TRUE)),
 av=replicate(1, sample(c(5:10), 100-i+1, rep=TRUE)))
 coh$num[coh$week.lt==1] <- sample(c(90:100), 1, rep=TRUE)
 ifelse(max(coh$date)>1, coh$num[coh$week.lt==2] <- sample(c(75:90), 1, rep=TRUE), NA)
 ifelse(max(coh$date)>2, coh$num[coh$week.lt==3] <- sample(c(60:75), 1, rep=TRUE), NA)
 ifelse(max(coh$date)>3, coh$num[coh$week.lt==4] <- sample(c(40:60), 1, rep=TRUE), NA)
 ifelse(max(coh$date)>34,
 {coh$num[coh$date==35] <- sample(c(60:85), 1, rep=TRUE)
 coh$av[coh$date==35] <- 4},
 NA)
 ifelse(max(coh$date)>47,
 {coh$num[coh$date==48] <- sample(c(60:85), 1, rep=TRUE)
 coh$av[coh$date==48] <- 4},
 NA)
 ifelse(max(coh$date)>86,
 {coh$num[coh$date==87] <- sample(c(60:85), 1, rep=TRUE)
 coh$av[coh$date==87] <- 4},
 NA)
 ifelse(max(coh$date)>99,
 {coh$num[coh$date==100] <- sample(c(60:85), 1, rep=TRUE)
 coh$av[coh$date==100] <- 4},
 NA)
 coh$gr.marg <- coh$av*coh$num
 cohorts <- rbind(cohorts, coh)
}

cohorts$cohort <- formatC(cohorts$cohort, width=3, format='d', flag='0')
cohorts$cohort <- paste('coh:week:', cohorts$cohort, sep='')
cohorts$date <- formatC(cohorts$date, width=3, format='d', flag='0')
cohorts$date <- paste('cal_week:', cohorts$date, sep='')
cohorts$week.lt <- formatC(cohorts$week.lt, width=3, format='d', flag='0')
cohorts$week.lt <- paste('week:', cohorts$week.lt, sep='')

#calculating CLV to date
cohorts <- cohorts %>%
 group_by(cohort) %>%
 mutate(clv=cumsum(gr.marg)/num[week.lt=='week:001'])

#color palette
cols <- c("#e7f0fa", "#c9e2f6", "#95cbee", "#0099dc", "#4ab04a", "#ffd73e", "#eec73a", "#e29421", "#e29421", "#f05336", "#ce472e")

#Heatmap based on Number of active customers
t <- max(cohorts$num)

ggplot(cohorts, aes(y=cohort, x=date, fill=num)) +
 theme_minimal() +
 geom_tile(colour="white", linewidth=2, width=.9, height=.9) +
 scale_fill_gradientn(colours=cols, limits=c(0, t),
 breaks=seq(0, t, by=t/4),
 labels=c("0", round(t/4*1, 1), round(t/4*2, 1), round(t/4*3, 1), round(t/4*4, 1)),
 guide=guide_colourbar(ticks=T, nbin=50, barheight=.5, label=T, barwidth=10)) +
 theme(legend.position='bottom',
 legend.direction="horizontal",
 plot.title = element_text(size=20, face="bold", vjust=2),
 axis.text.x=element_text(size=8, angle=90, hjust=.5, vjust=.5, face="plain")) +
 ggtitle("Cohort Activity Heatmap (number of customers who purchased - calendar view)")

ggplot(cohorts, aes(y=cohort, x=week.lt, fill=num)) +
 theme_minimal() +
 geom_tile(colour="white", linewidth=2, width=.9, height=.9) +
 scale_fill_gradientn(colours=cols, limits=c(0, t),
 breaks=seq(0, t, by=t/4),
 labels=c("0", round(t/4*1, 1), round(t/4*2, 1), round(t/4*3, 1), round(t/4*4, 1)),
 guide=guide_colourbar(ticks=T, nbin=50, barheight=.5, label=T, barwidth=10)) +
 theme(legend.position='bottom',
 legend.direction="horizontal",
 plot.title = element_text(size=20, face="bold", vjust=2),
 axis.text.x=element_text(size=8, angle=90, hjust=.5, vjust=.5, face="plain")) +
 ggtitle("Cohort Activity Heatmap (number of customers who purchased - lifetime view)")

# Heatmap based on Gross margin
t <- max(cohorts$gr.marg)

ggplot(cohorts, aes(y=cohort, x=date, fill=gr.marg)) +
 theme_minimal() +
 geom_tile(colour="white", linewidth=2, width=.9, height=.9) +
 scale_fill_gradientn(colours=cols, limits=c(0, t),
 breaks=seq(0, t, by=t/4),
 labels=c("0", round(t/4*1, 1), round(t/4*2, 1), round(t/4*3, 1), round(t/4*4, 1)),
 guide=guide_colourbar(ticks=T, nbin=50, barheight=.5, label=T, barwidth=10)) +
 theme(legend.position='bottom',
 legend.direction="horizontal",
 plot.title = element_text(size=20, face="bold", vjust=2),
 axis.text.x=element_text(size=8, angle=90, hjust=.5, vjust=.5, face="plain")) +
 ggtitle("Heatmap based on Gross margin (calendar view)")

ggplot(cohorts, aes(y=cohort, x=week.lt, fill=gr.marg)) +
 theme_minimal() +
 geom_tile(colour="white", linewidth=2, width=.9, height=.9) +
 scale_fill_gradientn(colours=cols, limits=c(0, t),
 breaks=seq(0, t, by=t/4),
 labels=c("0", round(t/4*1, 1), round(t/4*2, 1), round(t/4*3, 1), round(t/4*4, 1)),
 guide=guide_colourbar(ticks=T, nbin=50, barheight=.5, label=T, barwidth=10)) +
 theme(legend.position='bottom',
 legend.direction="horizontal",
 plot.title = element_text(size=20, face="bold", vjust=2),
 axis.text.x=element_text(size=8, angle=90, hjust=.5, vjust=.5, face="plain")) +
 ggtitle("Heatmap based on Gross margin (lifetime view)")

# Heatmap of per customer gross margin
t <- max(cohorts$av)

ggplot(cohorts, aes(y=cohort, x=date, fill=av)) +
 theme_minimal() +
 geom_tile(colour="white", linewidth=2, width=.9, height=.9) +
 scale_fill_gradientn(colours=cols, limits=c(0, t),
 breaks=seq(0, t, by=t/4),
 labels=c("0", round(t/4*1, 1), round(t/4*2, 1), round(t/4*3, 1), round(t/4*4, 1)),
 guide=guide_colourbar(ticks=T, nbin=50, barheight=.5, label=T, barwidth=10)) +
 theme(legend.position='bottom',
 legend.direction="horizontal",
 plot.title = element_text(size=20, face="bold", vjust=2),
 axis.text.x=element_text(size=8, angle=90, hjust=.5, vjust=.5, face="plain")) +
 ggtitle("Heatmap based on per customer gross margin (calendar view)")

ggplot(cohorts, aes(y=cohort, x=week.lt, fill=av)) +
 theme_minimal() +
 geom_tile(colour="white", linewidth=2, width=.9, height=.9) +
 scale_fill_gradientn(colours=cols, limits=c(0, t),
 breaks=seq(0, t, by=t/4),
 labels=c("0", round(t/4*1, 1), round(t/4*2, 1), round(t/4*3, 1), round(t/4*4, 1)),
 guide=guide_colourbar(ticks=T, nbin=50, barheight=.5, label=T, barwidth=10)) +
 theme(legend.position='bottom',
 legend.direction="horizontal",
 plot.title = element_text(size=20, face="bold", vjust=2),
 axis.text.x=element_text(size=8, angle=90, hjust=.5, vjust=.5, face="plain")) +
 ggtitle("Heatmap based on per customer gross margin (lifetime view)")

# Heatmap of CLV to date
t <- max(cohorts$clv)

ggplot(cohorts, aes(y=cohort, x=date, fill=clv)) +
 theme_minimal() +
 geom_tile(colour="white", linewidth=2, width=.9, height=.9) +
 scale_fill_gradientn(colours=cols, limits=c(0, t),
 breaks=seq(0, t, by=t/4),
 labels=c("0", round(t/4*1, 1), round(t/4*2, 1), round(t/4*3, 1), round(t/4*4, 1)),
 guide=guide_colourbar(ticks=T, nbin=50, barheight=.5, label=T, barwidth=10)) +
 theme(legend.position='bottom',
 legend.direction="horizontal",
 plot.title = element_text(size=20, face="bold", vjust=2),
 axis.text.x=element_text(size=8, angle=90, hjust=.5, vjust=.5, face="plain")) +
 ggtitle("Heatmap based on CLV to date of customers who ever purchased (calendar view)")

ggplot(cohorts, aes(y=cohort, x=week.lt, fill=clv)) +
 theme_minimal() +
 geom_tile(colour="white", linewidth=2, width=.9, height=.9) +
 scale_fill_gradientn(colours=cols, limits=c(0, t),
 breaks=seq(0, t, by=t/4),
 labels=c("0", round(t/4*1, 1), round(t/4*2, 1), round(t/4*3, 1), round(t/4*4, 1)),
 guide=guide_colourbar(ticks=T, nbin=50, barheight=.5, label=T, barwidth=10)) +
 theme(legend.position='bottom',
 legend.direction="horizontal",
 plot.title = element_text(size=20, face="bold", vjust=2),
 axis.text.x=element_text(size=8, angle=90, hjust=.5, vjust=.5, face="plain")) +
 ggtitle("Heatmap based on CLV to date of customers who ever purchased (lifetime view)")


 → Auto →
  or
or  →
→ 


 The post is broken into the following sections:


